# Details of the Plants
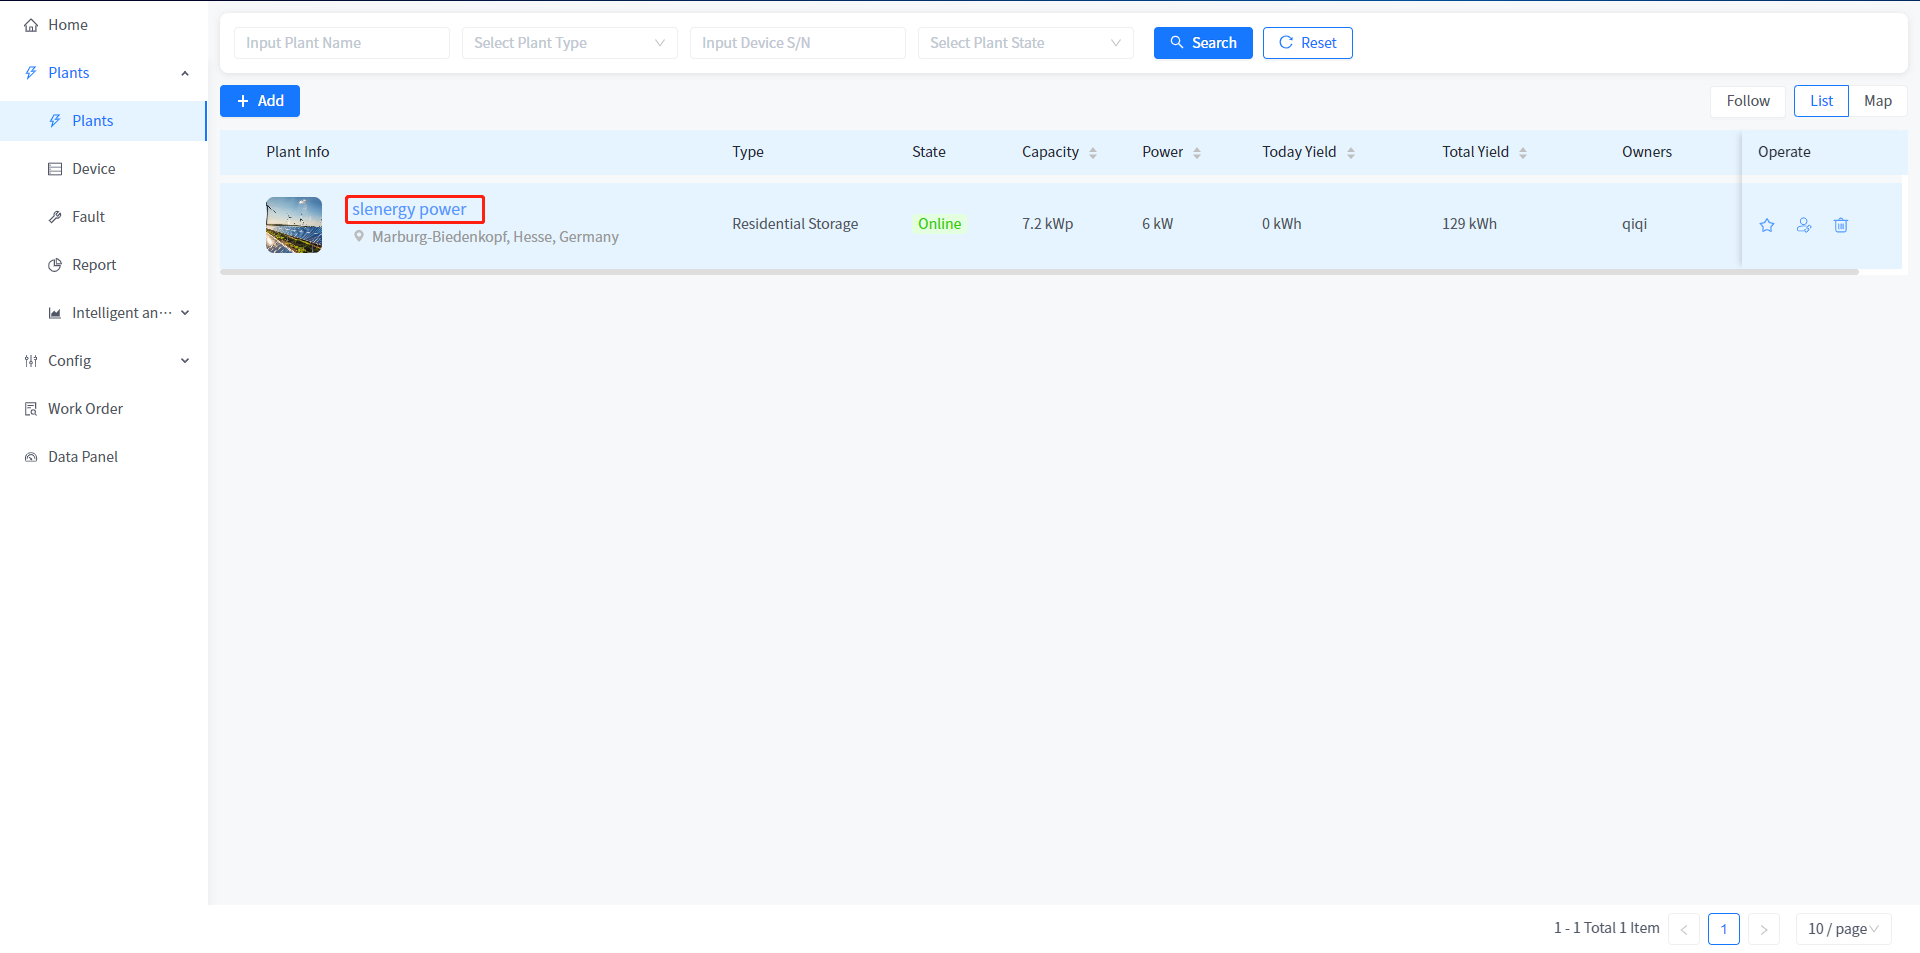
The system supports the viewing of individual plant information, device information, fault information, report statistics, and curve analysis data. You can click the plant name on the plant list page to access the plant overview page of plant details.
Overview
SHAANXI COAL NEW ENERGY The current version supports the construction of two different types of power stations and displays detailed information about these types of power stations.
- Overview of photovoltaic plants
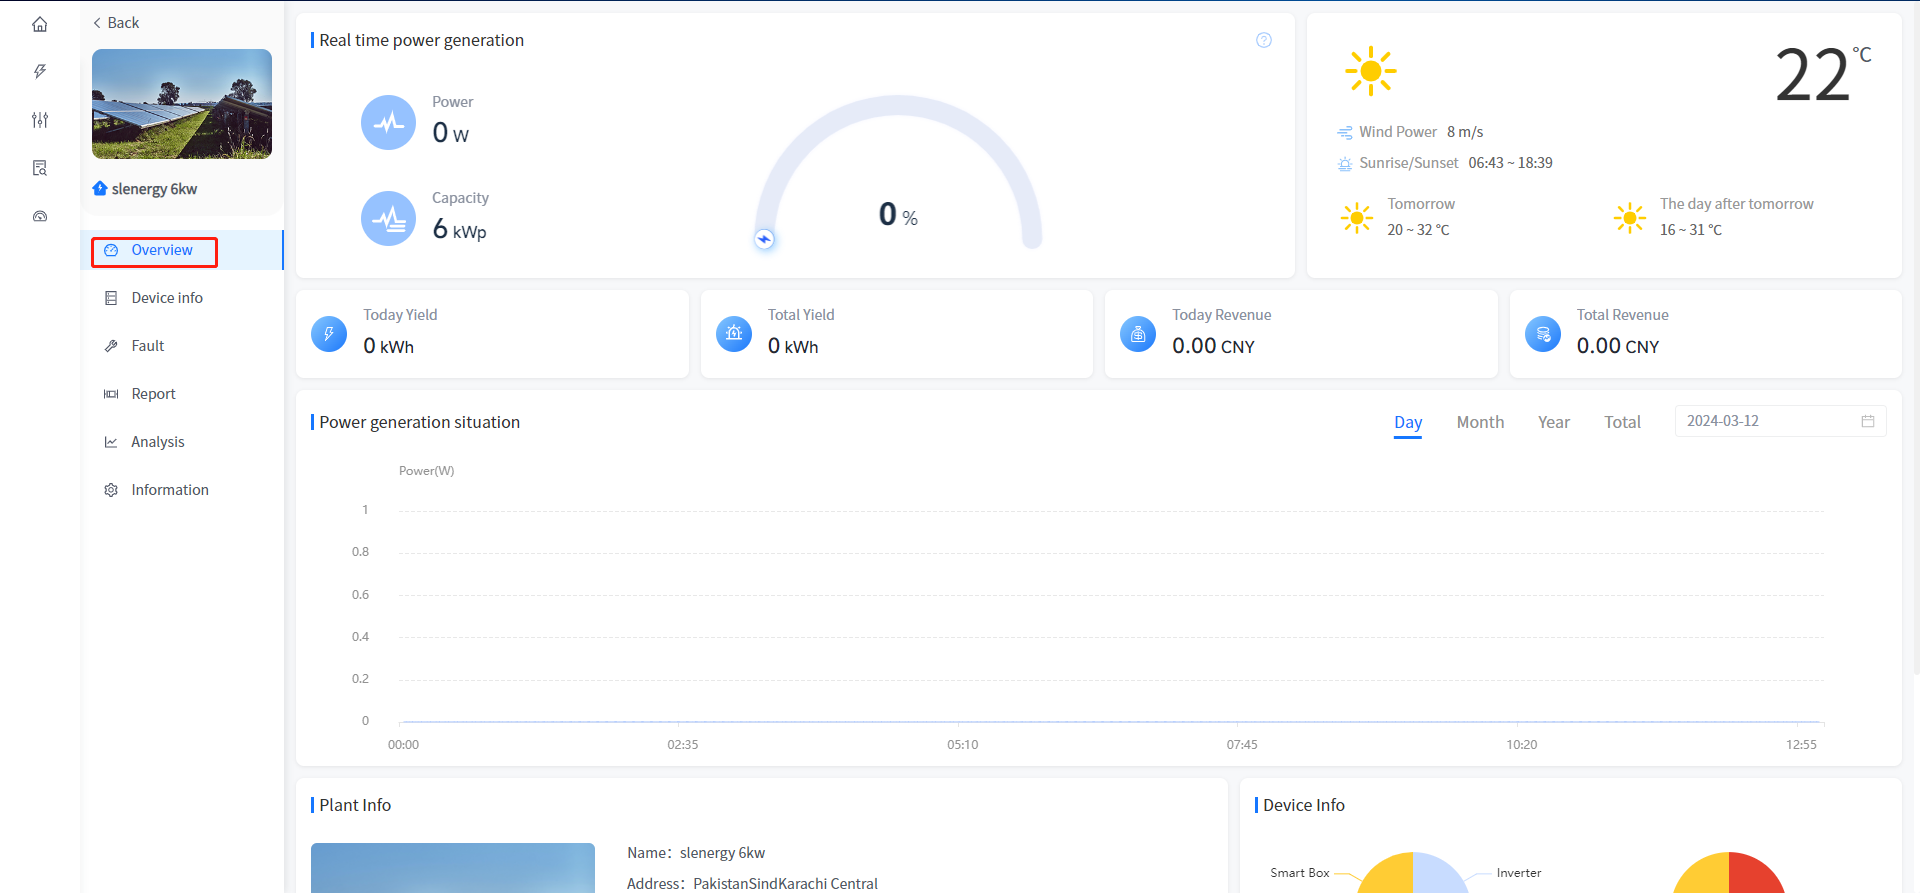
[Real-time power generation] Display the current power, total installed power and power generation firepower data of the plant, and the calculation logic is consistent with the data calculation logic on the home page.
[Weather] Show the weather conditions of the area where the plant is located.
[Today Yield] Displays the power generation of the plant up to the current time.
[Total Yield] Displays the cumulative power generation of the plant.
[Today Revenue] Show the income of the plant today, the calculation logic is consistent with the home page.
[Total Revenue] Show the cumulative income of the plant, and the calculation logic is consistent with the home page.
[Power generation situation] Show the power generation situation of the plant, the function and logic are consistent with the home page.
[Plant Info] Displays basic information about the plant.
[Device Info] The ring diagram shows all the Device associated with the plant.
[Energy saving and emission reduction] Show the energy conservation and emission reduction of the plant, the calculation logic is consistent with the home page.
- Energy storage power plant overview
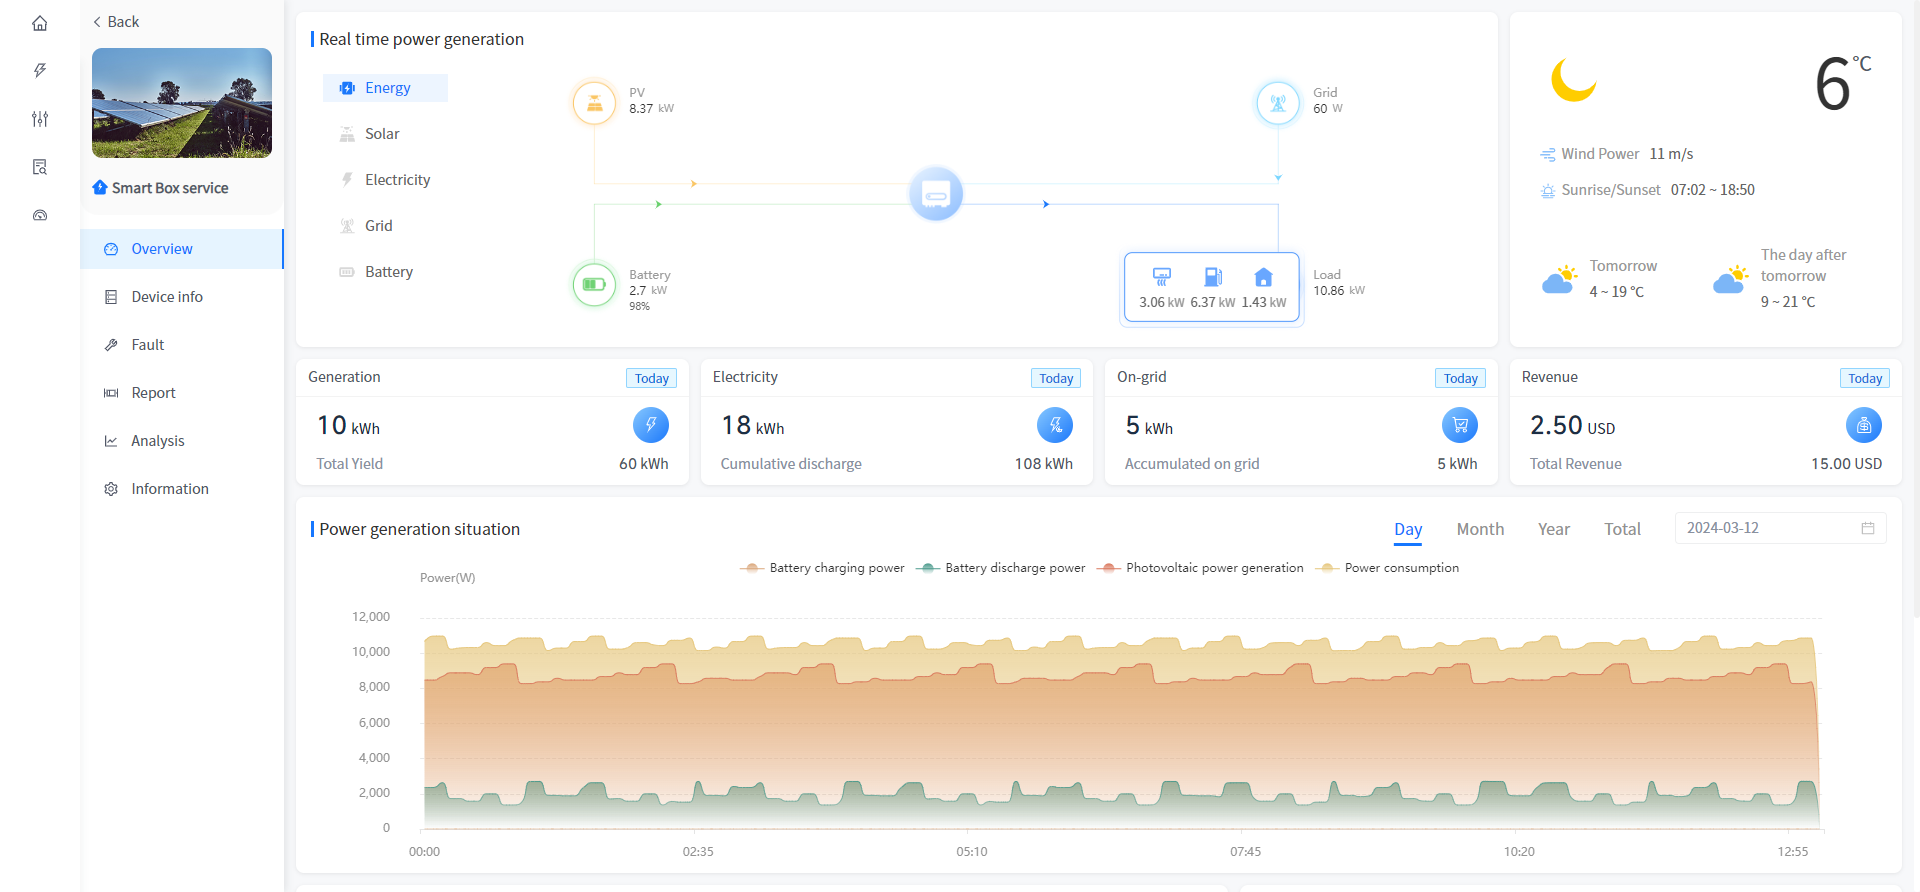
[Energy] Show the current power flow situation of the plant, according to some relevant rules.
[Solar] Displays the current power of the plant, the total installed power, the power generation value, today's power generation, this month's power generation, this year's power generation and cumulative power generation.
[Electricity] Display the power consumption, electricity consumption of the day, electricity consumption of the month, electricity consumption of the year and cumulative electricity consumption of the plant.
[Grid] Displays the data of power grid power, grid-connected volume of the day, grid-connected volume of the month, grid-connected volume of the year, cumulative grid-connected volume, electricity purchased on the day, electricity purchased in the month, electricity purchased in the year and cumulative electricity purchased.
[Battery] Display the battery power of the plant, the charging amount of the day, the charging amount of the month, the charging amount of the year, the cumulative charging amount, the discharge amount of the day, the discharge amount of the month, the discharge amount of the year and the cumulative discharge data.
[Weather] Show the weather conditions of the area where the plant is located.
[Generation] Displays the current power generation and cumulative power generation of the plant.
[Electricity] Show the current electricity consumption and cumulative electricity consumption of the plant.
[On-grid] Show the current grid-connected electricity and cumulative grid-connected electricity of the plant.
[Revenue] Show the current income and cumulative income of the plant.
[Power generation situation] Show the photovoltaic power generation power, electricity consumption power and battery charging and discharging power of the plant, and show the correct power data for months, years and accumulative.
[Plant Info] Displays basic information about the plant.
[Device Info]The ring diagram shows all the Device associated with the plant.
[Energy Conservation and Emission Reduction] Show the energy conservation and emission reduction of the plant, the calculation logic is consistent with the home page.